 Index
Index 
I spent the last week or so revisiting calcium slubility of sea shells and coral skeletons. I found two graphs on Wikipedia: "Calcium Solubility"; traced them in Adobe Illustrator; adjusted to x-axes to match; reversed pH scale to match temperature scale; and shifted y-axes to align at temperature 17°C and pH 8.1 (average ocean conditions). Results are shown in the black graph; the range of mid-latitude ocean are hinted by yellow. These graphs demonstrate that as temperature increases calcium solubility decreases. As pH decreases (i.e. becomes more acid) calcium solubility increases due to increasing partial pressure of CO2 in the atmosphere caused by burning carbon. Increasing temperatures thus tend to cancel effects of acidification due to climate change in shell solubility in the temperature range of interest, slopes and magnitudes of the curves from the poles to the equator (0°C to 30°C). Equation CaCO3 + (CO carbonic acid bicarbonate 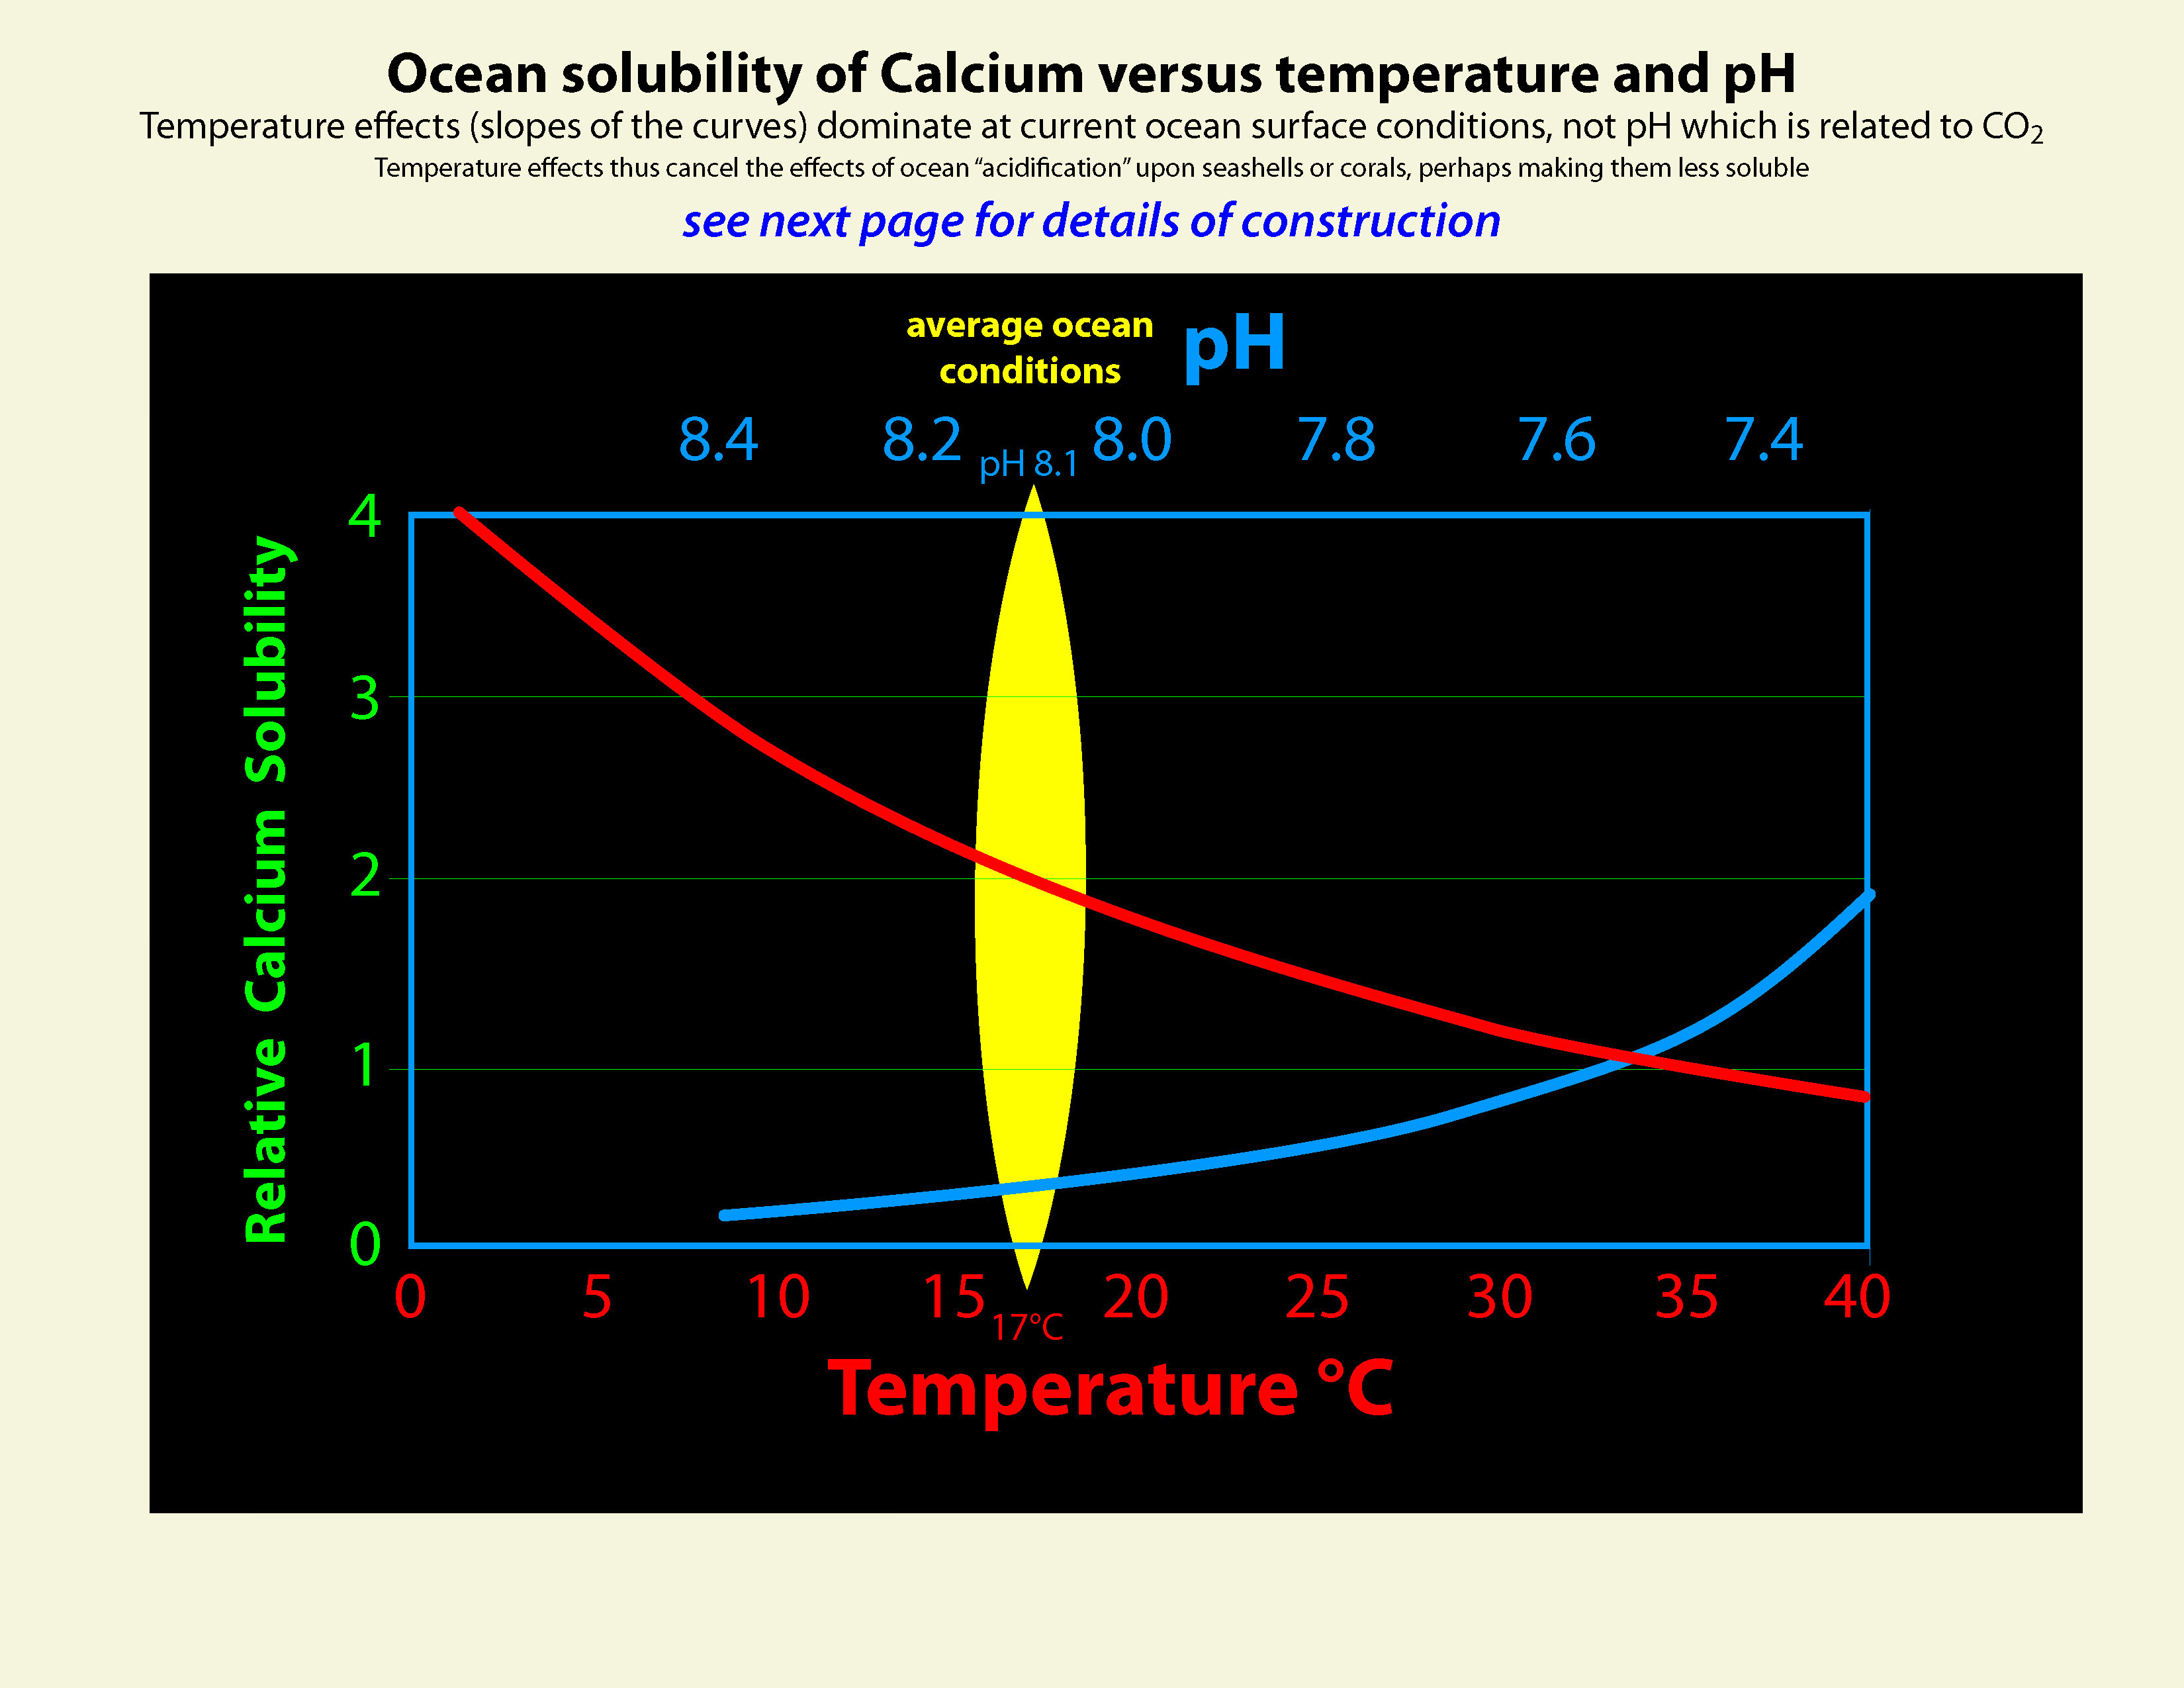 |
Graphic construction in Adobe Illustrator (left) based on two graphs from Wikipedia "Calcium Carbonate" (center right) aligned at ocean average T and pH on construction (pH mirrored image) 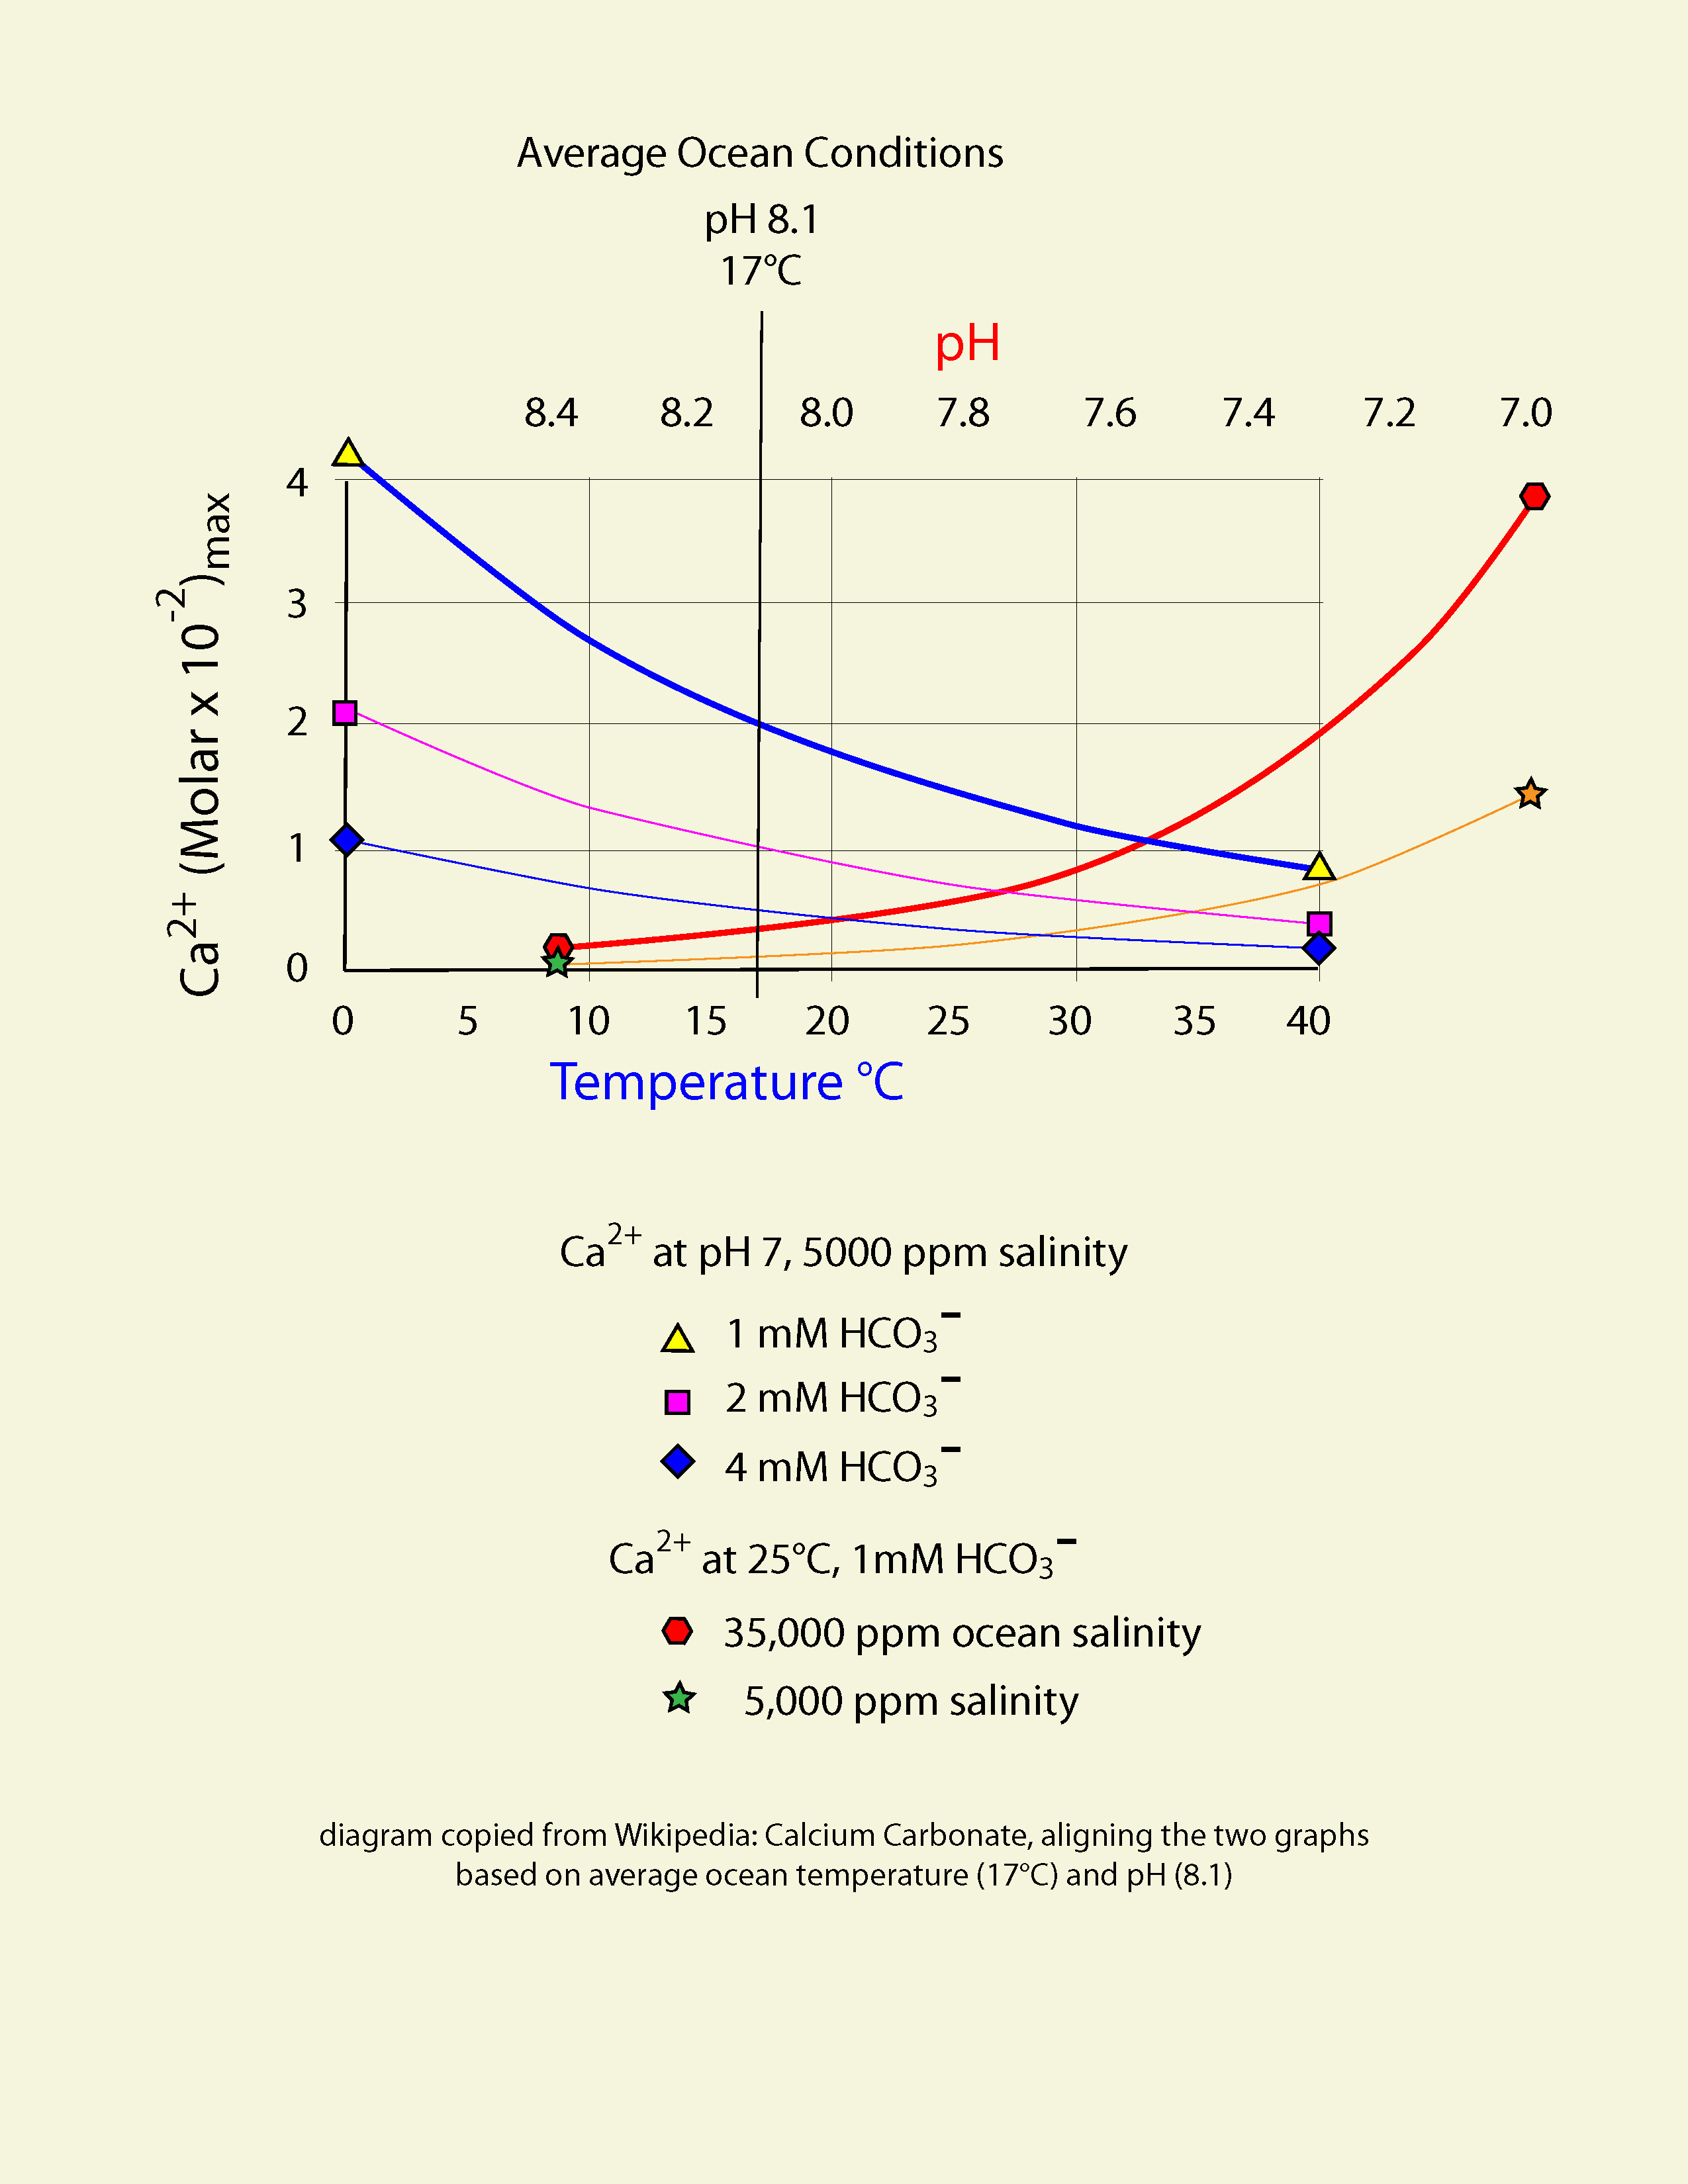 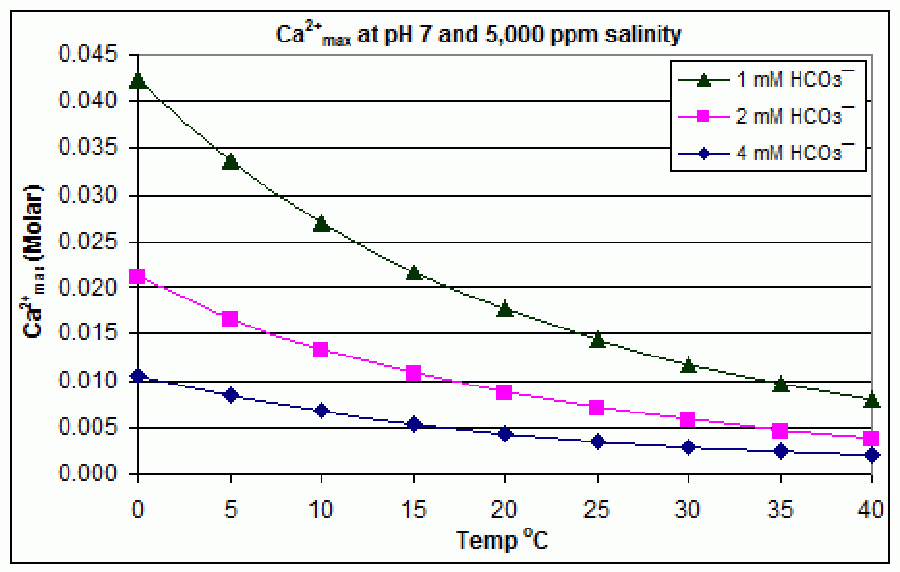 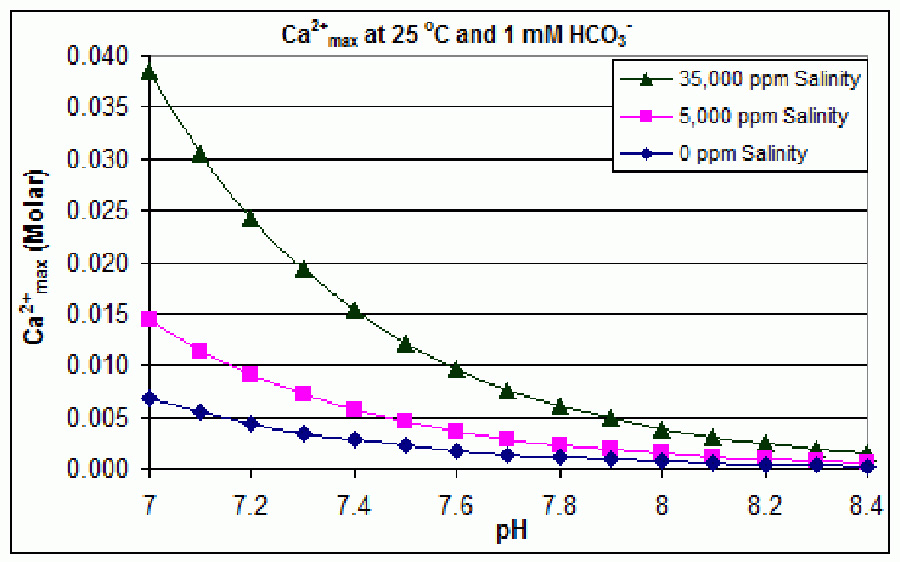 Support graphs from Wikipedia further extending range of axes; pulled together 20131115 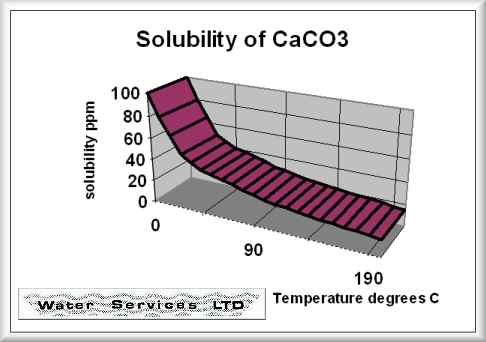 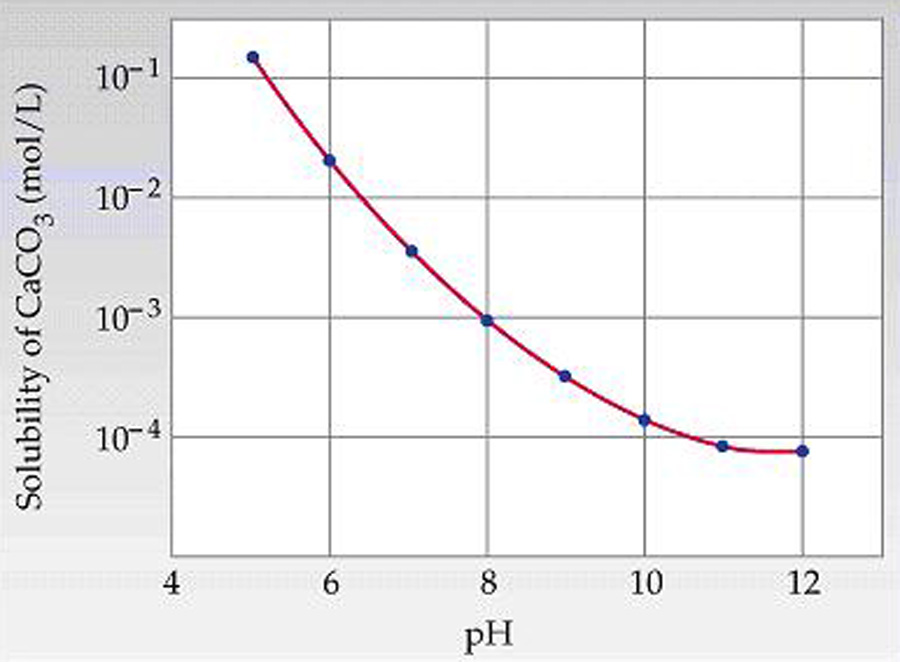  
|